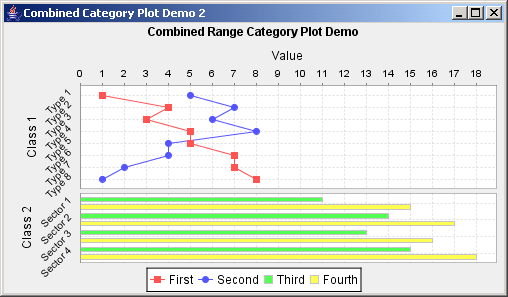
JFreeChart: Combined Category Plot Demo 2: bar chart on the left, and a line chart on the right
/* ===========================================================
 * JFreeChart : a free chart library for the Java(tm) platform
 * ===========================================================
 *
 * (C) Copyright 2000-2004, by Object Refinery Limited and Contributors.
 *
 * Project Info:  http://www.jfree.org/jfreechart/index.html
 *
 * This library is free software; you can redistribute it and/or modify it under the terms
 * of the GNU Lesser General Public License as published by the Free Software Foundation;
 * either version 2.1 of the License, or (at your option) any later version.
 *
 * This library is distributed in the hope that it will be useful, but WITHOUT ANY WARRANTY;
 * without even the implied warranty of MERCHANTABILITY or FITNESS FOR A PARTICULAR PURPOSE.
 * See the GNU Lesser General Public License for more details.
 *
 * You should have received a copy of the GNU Lesser General Public License along with this
 * library; if not, write to the Free Software Foundation, Inc., 59 Temple Place, Suite 330,
 * Boston, MA 02111-1307, USA.
 *
 * [Java is a trademark or registered trademark of Sun Microsystems, Inc.
 * in the United States and other countries.]
 *
 * ------------------------
 * CombinedXYPlotDemo2.java
 * ------------------------
 * (C) Copyright 2002-2004, by Object Refinery Limited.
 *
 * Original Author:  David Gilbert (for Object Refinery Limited).
 * Contributor(s):   -;
 *
 * $Id $
 *
 * Changes
 * -------
 * 23-Apr-2002 : Version 1 (DG);
 * 23-May-2002 : Renamed MultiPlotDemo --> CombinedXYPlotDemo (DG);
 * 25-Jun-2002 : Removed unnecessary imports (DG);
 * 10-Oct-2002 : Fixed errors reported by Checkstyle (DG);
 * 25-Feb-2004 : Renamed XYToolTipGenerator --> XYItemLabelGenerator (DG);
 *
 */

package org.jfree.chart.demo;

import java.text.DecimalFormat;
import java.text.SimpleDateFormat;

import org.jfree.chart.ChartPanel;
import org.jfree.chart.JFreeChart;
import org.jfree.chart.axis.DateAxis;
import org.jfree.chart.axis.NumberAxis;
import org.jfree.chart.labels.StandardXYToolTipGenerator;
import org.jfree.chart.plot.CombinedRangeXYPlot;
import org.jfree.chart.plot.XYPlot;
import org.jfree.chart.renderer.xy.StandardXYItemRenderer;
import org.jfree.chart.renderer.xy.XYBarRenderer;
import org.jfree.chart.renderer.xy.XYItemRenderer;
import org.jfree.data.time.Day;
import org.jfree.data.time.TimeSeries;
import org.jfree.data.time.TimeSeriesCollection;
import org.jfree.data.xy.IntervalXYDataset;
import org.jfree.data.xy.XYDataset;
import org.jfree.date.SerialDate;
import org.jfree.ui.ApplicationFrame;
import org.jfree.ui.RefineryUtilities;

/**
 * A demonstration application showing how to create a combined chart.  A
 * bar chart is displayed on the left, and a line chart on the right.
 *
 */
public class CombinedXYPlotDemo2 extends ApplicationFrame {

    /**
     * Constructs a new demonstration application.
     *
     * @param title  the frame title.
     */
    public CombinedXYPlotDemo2(final String title) {

        super(title);
        final JFreeChart chart = createCombinedChart();
        final ChartPanel panel = new ChartPanel(chart, true, true, true, false, true);
        panel.setPreferredSize(new java.awt.Dimension(500, 270));
        setContentPane(panel);

    }

    /**
     * Creates a combined XYPlot chart.
     *
     * @return the combined chart.
     */
    private JFreeChart createCombinedChart() {

        // create subplot 1...
        final IntervalXYDataset data1 = createDataset1();
        final XYItemRenderer renderer1 = new XYBarRenderer(0.20);
        renderer1.setToolTipGenerator(
            new StandardXYToolTipGenerator(
                StandardXYToolTipGenerator.DEFAULT_TOOL_TIP_FORMAT,
                new SimpleDateFormat("d-MMM-yyyy"), new DecimalFormat("0,000.0")
            )
        );
        final XYPlot subplot1 = new XYPlot(data1, new DateAxis("Date"), null, renderer1);

        // create subplot 2...
        final XYDataset data2 = createDataset2();
        final XYItemRenderer renderer2 = new StandardXYItemRenderer();
        renderer2.setToolTipGenerator(
            new StandardXYToolTipGenerator(
                StandardXYToolTipGenerator.DEFAULT_TOOL_TIP_FORMAT,
                new SimpleDateFormat("d-MMM-yyyy"), new DecimalFormat("0,000.0")
            )
        );
        final XYPlot subplot2 = new XYPlot(data2, new DateAxis("Date"), null, renderer2);

        // create a parent plot...
        final CombinedRangeXYPlot plot = new CombinedRangeXYPlot(new NumberAxis("Value"));

        // add the subplots...
        plot.add(subplot1, 1);
        plot.add(subplot2, 1);

        // return a new chart containing the overlaid plot...
        return new JFreeChart(
            "Combined (Range) XY Plot", JFreeChart.DEFAULT_TITLE_FONT, plot, true
        );

    }

    // ****************************************************************************
    // * JFREECHART DEVELOPER GUIDE                                               *
    // * The JFreeChart Developer Guide, written by David Gilbert, is available   *
    // * to purchase from Object Refinery Limited:                                *
    // *                                                                          *
    // * http://www.object-refinery.com/jfreechart/guide.html                     *
    // *                                                                          *
    // * Sales are used to provide funding for the JFreeChart project - please    *
    // * support us so that we can continue developing free software.             *
    // ****************************************************************************

    /**
     * Creates a sample dataset.
     *
     * @return Series 1.
     */
    private IntervalXYDataset createDataset1() {

        // create dataset 1...
        final TimeSeries series1 = new TimeSeries("Series 1", Day.class);
        series1.add(new Day(1, SerialDate.MARCH, 2002), 12353.3);
        series1.add(new Day(2, SerialDate.MARCH, 2002), 13734.4);
        series1.add(new Day(3, SerialDate.MARCH, 2002), 14525.3);
        series1.add(new Day(4, SerialDate.MARCH, 2002), 13984.3);
        series1.add(new Day(5, SerialDate.MARCH, 2002), 12999.4);
        series1.add(new Day(6, SerialDate.MARCH, 2002), 14274.3);
        series1.add(new Day(7, SerialDate.MARCH, 2002), 15943.5);
        series1.add(new Day(8, SerialDate.MARCH, 2002), 14845.3);
        series1.add(new Day(9, SerialDate.MARCH, 2002), 14645.4);
        series1.add(new Day(10, SerialDate.MARCH, 2002), 16234.6);
        series1.add(new Day(11, SerialDate.MARCH, 2002), 17232.3);
        series1.add(new Day(12, SerialDate.MARCH, 2002), 14232.2);
        series1.add(new Day(13, SerialDate.MARCH, 2002), 13102.2);
        series1.add(new Day(14, SerialDate.MARCH, 2002), 14230.2);
        series1.add(new Day(15, SerialDate.MARCH, 2002), 11235.2);

        final TimeSeriesCollection collection = new TimeSeriesCollection(series1);
        collection.setDomainIsPointsInTime(false);  // this tells the time series collection that
                                                    // we intend the data to represent time periods
                                                    // NOT points in time.  This is required when
                                                    // determining the min/max values in the
                                                    // dataset's domain.
        return collection;

    }

    /**
     * Creates a sample dataset.
     *
     * @return Series 2.
     */
    private XYDataset createDataset2() {

        // create dataset 2...
        final TimeSeries series2 = new TimeSeries("Series 2", Day.class);

        series2.add(new Day(3, SerialDate.MARCH, 2002), 16853.2);
        series2.add(new Day(4, SerialDate.MARCH, 2002), 19642.3);
        series2.add(new Day(5, SerialDate.MARCH, 2002), 18253.5);
        series2.add(new Day(6, SerialDate.MARCH, 2002), 15352.3);
        series2.add(new Day(7, SerialDate.MARCH, 2002), 13532.0);
        series2.add(new Day(8, SerialDate.MARCH, 2002), 12635.3);
        series2.add(new Day(9, SerialDate.MARCH, 2002), 13998.2);
        series2.add(new Day(10, SerialDate.MARCH, 2002), 11943.2);
        series2.add(new Day(11, SerialDate.MARCH, 2002), 16943.9);
        series2.add(new Day(12, SerialDate.MARCH, 2002), 17843.2);
        series2.add(new Day(13, SerialDate.MARCH, 2002), 16495.3);
        series2.add(new Day(14, SerialDate.MARCH, 2002), 17943.6);
        series2.add(new Day(15, SerialDate.MARCH, 2002), 18500.7);
        series2.add(new Day(16, SerialDate.MARCH, 2002), 19595.9);

        return new TimeSeriesCollection(series2);

    }

    /**
     * Starting point for the demonstration application.
     *
     * @param args  ignored.
     */
    public static void main(final String[] args) {

        final CombinedXYPlotDemo2 demo = new CombinedXYPlotDemo2("Combined XY Plot Demo");
        demo.pack();
        RefineryUtilities.centerFrameOnScreen(demo);
        demo.setVisible(true);

    }

}
 jfreechart-1.0.0-rc1.zip( 3,559 k)
Related examples in the same category