JFreeChart: Combined Category Plot Demo 1
/* ===========================================================
* JFreeChart : a free chart library for the Java(tm) platform
* ===========================================================
*
* (C) Copyright 2000-2004, by Object Refinery Limited and Contributors.
*
* Project Info: http://www.jfree.org/jfreechart/index.html
*
* This library is free software; you can redistribute it and/or modify it under the terms
* of the GNU Lesser General Public License as published by the Free Software Foundation;
* either version 2.1 of the License, or (at your option) any later version.
*
* This library is distributed in the hope that it will be useful, but WITHOUT ANY WARRANTY;
* without even the implied warranty of MERCHANTABILITY or FITNESS FOR A PARTICULAR PURPOSE.
* See the GNU Lesser General Public License for more details.
*
* You should have received a copy of the GNU Lesser General Public License along with this
* library; if not, write to the Free Software Foundation, Inc., 59 Temple Place, Suite 330,
* Boston, MA 02111-1307, USA.
*
* [Java is a trademark or registered trademark of Sun Microsystems, Inc.
* in the United States and other countries.]
*
* ------------------------------
* CombinedCategoryPlotDemo1.java
* ------------------------------
* (C) Copyright 2003, 2004, by Object Refinery Limited.
*
* Original Author: David Gilbert (for Object Refinery Limited).
* Contributor(s): -;
*
* $Id: CombinedCategoryPlotDemo1.java,v 1.14 2004/05/10 16:45:22 mungady Exp $
*
* Changes
* -------
* 16-May-2003 : Version 1 (DG);
*
*/
package org.jfree.chart.demo;
import java.awt.Font;
import org.jfree.chart.ChartPanel;
import org.jfree.chart.JFreeChart;
import org.jfree.chart.axis.CategoryAxis;
import org.jfree.chart.axis.NumberAxis;
import org.jfree.chart.labels.StandardCategoryToolTipGenerator;
import org.jfree.chart.plot.CategoryPlot;
import org.jfree.chart.plot.CombinedDomainCategoryPlot;
import org.jfree.chart.renderer.category.BarRenderer;
import org.jfree.chart.renderer.category.LineAndShapeRenderer;
import org.jfree.data.category.CategoryDataset;
import org.jfree.data.category.DefaultCategoryDataset;
import org.jfree.ui.ApplicationFrame;
import org.jfree.ui.RefineryUtilities;
/**
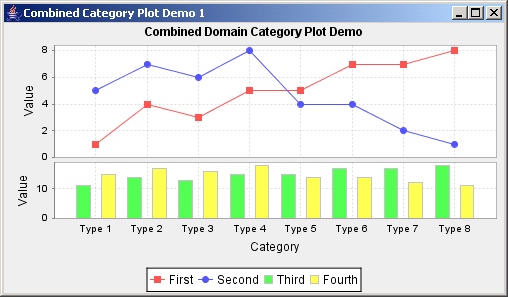
* A demo for the {@link CombinedDomainCategoryPlot} class.
*/
public class CombinedCategoryPlotDemo1 extends ApplicationFrame {
/**
* Creates a new demo instance.
*
* @param title the frame title.
*/
public CombinedCategoryPlotDemo1(final String title) {
super(title);
// add the chart to a panel...
final ChartPanel chartPanel = new ChartPanel(createChart());
chartPanel.setPreferredSize(new java.awt.Dimension(500, 270));
setContentPane(chartPanel);
}
/**
* Creates a dataset.
*
* @return A dataset.
*/
public CategoryDataset createDataset1() {
final DefaultCategoryDataset result = new DefaultCategoryDataset();
// row keys...
final String series1 = "First";
final String series2 = "Second";
// column keys...
final String type1 = "Type 1";
final String type2 = "Type 2";
final String type3 = "Type 3";
final String type4 = "Type 4";
final String type5 = "Type 5";
final String type6 = "Type 6";
final String type7 = "Type 7";
final String type8 = "Type 8";
result.addValue(1.0, series1, type1);
result.addValue(4.0, series1, type2);
result.addValue(3.0, series1, type3);
result.addValue(5.0, series1, type4);
result.addValue(5.0, series1, type5);
result.addValue(7.0, series1, type6);
result.addValue(7.0, series1, type7);
result.addValue(8.0, series1, type8);
result.addValue(5.0, series2, type1);
result.addValue(7.0, series2, type2);
result.addValue(6.0, series2, type3);
result.addValue(8.0, series2, type4);
result.addValue(4.0, series2, type5);
result.addValue(4.0, series2, type6);
result.addValue(2.0, series2, type7);
result.addValue(1.0, series2, type8);
return result;
}
/**
* Creates a dataset.
*
* @return A dataset.
*/
public CategoryDataset createDataset2() {
final DefaultCategoryDataset result = new DefaultCategoryDataset();
// row keys...
final String series1 = "Third";
final String series2 = "Fourth";
// column keys...
final String type1 = "Type 1";
final String type2 = "Type 2";
final String type3 = "Type 3";
final String type4 = "Type 4";
final String type5 = "Type 5";
final String type6 = "Type 6";
final String type7 = "Type 7";
final String type8 = "Type 8";
result.addValue(11.0, series1, type1);
result.addValue(14.0, series1, type2);
result.addValue(13.0, series1, type3);
result.addValue(15.0, series1, type4);
result.addValue(15.0, series1, type5);
result.addValue(17.0, series1, type6);
result.addValue(17.0, series1, type7);
result.addValue(18.0, series1, type8);
result.addValue(15.0, series2, type1);
result.addValue(17.0, series2, type2);
result.addValue(16.0, series2, type3);
result.addValue(18.0, series2, type4);
result.addValue(14.0, series2, type5);
result.addValue(14.0, series2, type6);
result.addValue(12.0, series2, type7);
result.addValue(11.0, series2, type8);
return result;
}
// ****************************************************************************
// * JFREECHART DEVELOPER GUIDE *
// * The JFreeChart Developer Guide, written by David Gilbert, is available *
// * to purchase from Object Refinery Limited: *
// * *
// * http://www.object-refinery.com/jfreechart/guide.html *
// * *
// * Sales are used to provide funding for the JFreeChart project - please *
// * support us so that we can continue developing free software. *
// ****************************************************************************
/**
* Creates a chart.
*
* @return A chart.
*/
private JFreeChart createChart() {
final CategoryDataset dataset1 = createDataset1();
final NumberAxis rangeAxis1 = new NumberAxis("Value");
rangeAxis1.setStandardTickUnits(NumberAxis.createIntegerTickUnits());
final LineAndShapeRenderer renderer1 = new LineAndShapeRenderer();
renderer1.setBaseToolTipGenerator(new StandardCategoryToolTipGenerator());
final CategoryPlot subplot1 = new CategoryPlot(dataset1, null, rangeAxis1, renderer1);
subplot1.setDomainGridlinesVisible(true);
final CategoryDataset dataset2 = createDataset2();
final NumberAxis rangeAxis2 = new NumberAxis("Value");
rangeAxis2.setStandardTickUnits(NumberAxis.createIntegerTickUnits());
final BarRenderer renderer2 = new BarRenderer();
renderer2.setBaseToolTipGenerator(new StandardCategoryToolTipGenerator());
final CategoryPlot subplot2 = new CategoryPlot(dataset2, null, rangeAxis2, renderer2);
subplot2.setDomainGridlinesVisible(true);
final CategoryAxis domainAxis = new CategoryAxis("Category");
final CombinedDomainCategoryPlot plot = new CombinedDomainCategoryPlot(domainAxis);
plot.add(subplot1, 2);
plot.add(subplot2, 1);
final JFreeChart result = new JFreeChart(
"Combined Domain Category Plot Demo",
new Font("SansSerif", Font.BOLD, 12),
plot,
true
);
// result.getLegend().setAnchor(Legend.SOUTH);
return result;
}
/**
* Starting point for the demonstration application.
*
* @param args ignored.
*/
public static void main(final String[] args) {
final String title = "Combined Category Plot Demo 1";
final CombinedCategoryPlotDemo1 demo = new CombinedCategoryPlotDemo1(title);
demo.pack();
RefineryUtilities.centerFrameOnScreen(demo);
demo.setVisible(true);
}
}
 jfreechart-1.0.0-rc1.zip( 3,559 k)
Related examples in the same category