Chart « Flex

Home
Flex
1.Chart
2.Components
3.Container
4.Data Model
5.Development
6.Effects
7.Event
8.Graphics
9.Grid
10.Style
Flex » ChartScreenshots 
Chart
Components
Container
Data Model
Development
Effects
Event
Graphics
Grid
Style
Image index for Chart : 1  2  3  4  5  6  7  8  9  10  11  12  13  14  15  16  17  18  19  20  21  22  23  24  25  26  27  28  29  30  

Using XML for LineChart  Click image to read the source code.


Using XML for LineChart


Variable Series for LineChart  Click image to read the source code.


Variable Series for LineChart


Formatting lines  Click image to read the source code.


Formatting lines


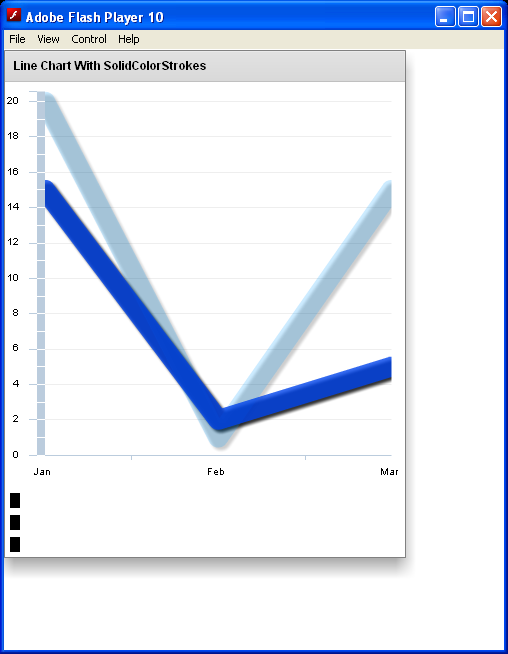
Basic Line Stroke  Click image to read the source code.


Basic Line Stroke


child tag to define these properties or define a stroke and then bind it to the axisStroke object, as the following example shows:  Click image to read the source code.


<mx:SolidColorStroke> child tag to define these properties or define a stroke and then bind it to the axisStroke object, as the following example shows:


The following example defines a PieChart control:  Click image to read the source code.


The following example defines a PieChart control:


creates a PieChart that uses only red, white, and blue colors for the wedges:  Click image to read the source code.


creates a PieChart that uses only red, white, and blue colors for the wedges:


Set selection model for PieChart to single selectable  Click image to read the source code.


Set selection model for PieChart to single selectable


java2s.com  | Contact Us | Privacy Policy
Copyright 2009 - 12 Demo Source and Support. All rights reserved.
All other trademarks are property of their respective owners.