| Home | ||||||||||||||||||||
| Flex | ||||||||||||||||||||
|
| Flex » Chart | Screenshots |
| Image index for Chart : 1 2 3 4 5 6 7 8 9 10 11 12 13 14 15 16 17 18 19 20 21 22 23 24 25 26 27 28 29 30 |
| Setting a value for the minField property creates two values on the axis for each data point in an area Click image to read the source code. |
 |
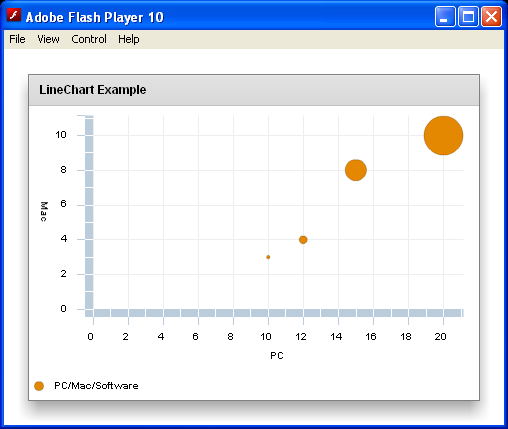
| Bubble Chart Click image to read the source code. |
 |
| Axis for Bubble Chart Click image to read the source code. |
 |
| Legend for Bubble Chart Click image to read the source code. |
 |
| Show data tops for Bubble Chart Click image to read the source code. |
 |
| Max radius for Bubble Chart Click image to read the source code. |
 |
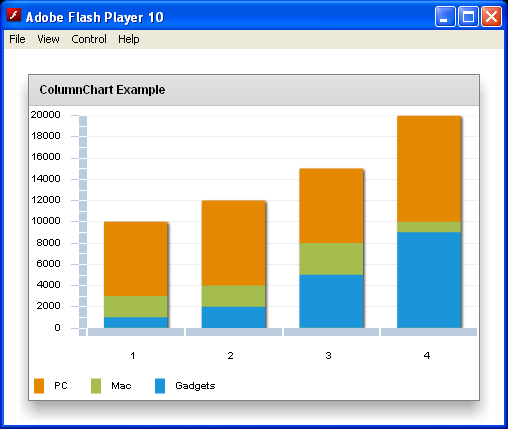
| ColumnChart Demo Click image to read the source code. |
 |
| Column Chart Demo and CategoryAxis Click image to read the source code. |
|