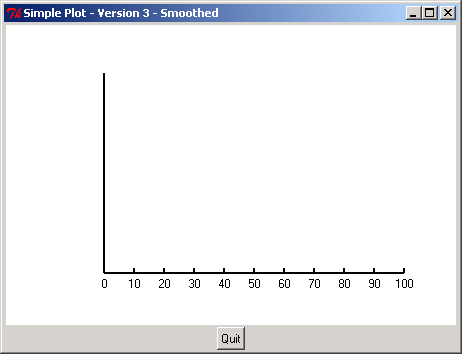
Canvas: Simple plot

/*

An Introduction to Tkinter
Fredrik Lundh

http://www.pythonware.com/library/tkinter/introduction/


Copyright 1999 by Fredrik Lundh
*/


from Tkinter import *

def main():
    root = Tk()
    root.title('Simple Plot - Version 3 - Smoothed')

    try:
        canvas = Canvas(root, width=450, height=300, bg = 'white')
        canvas.pack()
        Button(root, text='Quit', command=root.quit).pack()

        canvas.create_line(100,250,400,250, width=2)
        canvas.create_line(100,250,100,50,  width=2)

        for i in range(11):
            x = 100 + (i * 30)
            canvas.create_line(x,250,x,245, width=2)
            canvas.create_text(x,254, text='%d'% (10*i), anchor=N)

        for i in range(6):
            x = 250 - (i + 40)
            canvas.create_line(100,y,105,y, width=2)
            canvas.create_text(96,y, text='%5.1f'% (50.*i), anchor=E)

        scaled = []
        for x,y in [(12, 56), (20, 94), (33, 98), (45, 120), (61, 180),
                    (75, 160), (98, 223)]:
            scaled.append(100 + 3*x, 250 - (4*y)/5)

        canvas.create_line(scaled, fill='black', smooth=1)

        for xs,ys in scaled:
            canvas.create_oval(x-6,y-6,x+6,y+6, width=1,
                               outline='black', fill='SkyBlue2')
    except:
        print 'An error has occured!'

    root.mainloop()

main()
Related examples in the same category