Trace curve
/*************************************************************************
* *
* This source code file, and compiled classes derived from it, can *
* be used and distributed without restriction, including for commercial *
* use. (Attribution is not required but is appreciated.) *
* *
* David J. Eck *
* Department of Mathematics and Computer Science *
* Hobart and William Smith Colleges *
* Geneva, New York 14456, USA *
* Email: eck@hws.edu WWW: http://math.hws.edu/eck/ *
* *
*************************************************************************/
// The ParametricCurve applet is a configurable applet that displays a parametric
// curve defined by two functions of a parameter t. There can be a "Tracer" button
// on the applet. When the user clicks this button, a crosshair is moved along
// the curve from beginning to end.
import java.awt.*;
import java.applet.Applet;
import java.util.StringTokenizer;
import java.util.Hashtable;
import edu.hws.jcm.draw.*;
import edu.hws.jcm.data.*;
import edu.hws.jcm.functions.*;
import edu.hws.jcm.awt.*;
public class Parametric extends GenericGraphApplet {
// Declare some private variables that are created in one method in
// this class and used in a second method.
private Function xFunc,yFunc; // The functions that are graphed.
private ParametricCurve graph; // The graph of the function.
private Animator tracer; // for tracing the curve by moving a crosshair along it
private Crosshair crosshair; // Crosshair used for tracing the graph
private VariableInput tMin,tMax; // for inputting limits on t
private VariableInput tIntervals; // for inutting the number of intervals into which the t-range is divided
private ExpressionInput functionInput2; // for inputting yFunc; xFunc is input in functionInput
protected void setUpParameterDefaults() {
parameterDefaults = new Hashtable();
parameterDefaults.put("TwoLimitsColumns", "yes");
parameterDefaults.put("Variable","t");
parameterDefaults.put("XName","x"); // we need this so that xmin and xmax boxes are labeled correctly;
// without it, the name would come from the variable name, t, instead of x
parameterDefaults.put("FunctionLabel", " " + getParameter("XName") + "(" + getParameter("Variable") + ") = ");
parameterDefaults.put("FunctionLabel2", " " + getParameter("YName","y") + "(" + getParameter("Variable") + ") = ");
}
protected void setUpCanvas() { // Override this to add more stuff to the canvas.
super.setUpCanvas(); // Do the common setup: Add the axes and
// When setUpCanvas is called, the function inputs already exist, if they are
// to be used, since they are created in setUpBopttomPanel(), which is called
// before setUpCanvas(). If functionInput exists, add a graph of the functions
// from functionInput and functionInput2 to the canvas. If not, create a graph
// of the functions specified by the parameters named "Function" and "Function2".
if (functionInput != null) {
xFunc = functionInput.getFunction(xVar);
yFunc = functionInput2.getFunction(xVar);
}
else {
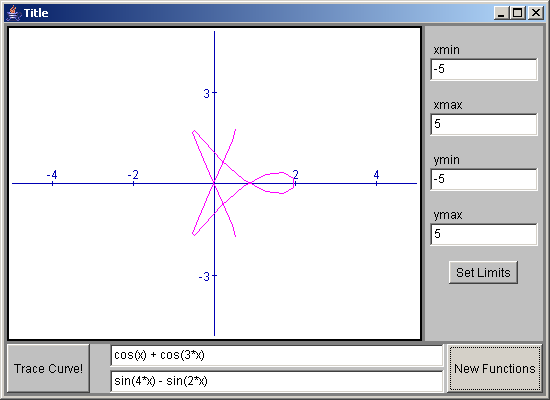
String xFuncDef = " cos(" + xVar.getName() + ") + cos(3*" + xVar.getName() + ")";
String yFuncDef = " sin(4*" + xVar.getName() + ") - sin(2*" + xVar.getName() + ")";
xFuncDef = getParameter("Function", xFuncDef);
yFuncDef = getParameter("Function2", yFuncDef);
Function f = new SimpleFunction( parser.parse(xFuncDef), xVar );
xFunc = new WrapperFunction(f);
f = new SimpleFunction( parser.parse(yFuncDef), xVar );
yFunc = new WrapperFunction(f);
}
graph = new ParametricCurve(xFunc,yFunc);
Color color = getColorParam("CurveColor");
if (color != null)
graph.setColor(color);
// if inputs are desired to control the parameter on the curve, set them up here
if ("no".equalsIgnoreCase(getParameter("UseParamInputs","yes"))) {
tMin = new VariableInput(xVar.getName() + "Start",getParameter("ParameterMin","-2"));
tMax = new VariableInput(xVar.getName() + "End",getParameter("ParameterMax","2"));
tIntervals = new VariableInput("Intervals", getParameter("Intervals","200"));
tIntervals.setInputStyle(VariableInput.INTEGER);
tIntervals.setMin(1);
tIntervals.setMax(5000);
tMin.setOnUserAction(mainController);
tMax.setOnUserAction(mainController);
tIntervals.setOnUserAction(mainController);
graph.setTMin(tMin);
graph.setTMax(tMax);
graph.setIntervals(tIntervals);
if (limitsPanel != null) {
// componets will be added to limitsPanel in setUpLimitsPanel()
mainController.add(tMin); // This is not done automatically, since they are in a limits panel
mainController.add(tMax);
mainController.add(tIntervals);
}
else {
JCMPanel ap = new JCMPanel(9,0);
ap.setBackground(getColorParam("PanelBackground", Color.lightGray));
ap.add(new Label(tMin.getName()));
ap.add(tMin);
ap.add(new Label());
ap.add(new Label(tMax.getName()));
ap.add(tMax);
ap.add(new Label());
ap.add(new Label(tIntervals.getName()));
ap.add(tIntervals);
ap.add(new Label());
mainPanel.add(ap,BorderLayout.EAST);
}
}
else {
try {
graph.setTMin( new Constant((new Double(getParameter("ParameterMin","-2"))).doubleValue()) );
graph.setTMax( new Constant((new Double(getParameter("ParameterMax","2"))).doubleValue()) );
graph.setIntervals( new Constant((new Double(getParameter("Intervals","25"))).doubleValue()) );
}
catch (NumberFormatException e) {
}
}
// If the applet is configured to have a tracer button, create it and add the crosshair to the canvas
if (! "no".equalsIgnoreCase( getParameter("UseTracer","yes") ) ) {
tracer = new Animator();
tracer.setMin(graph.getTMin());
tracer.setMax(graph.getTMax());
tracer.setUndefinedWhenNotRunning(true);
tracer.setStartButtonName("Trace Curve!");
double[] d = getNumericParam("TracerIntervals");
int ints;
if (d == null || d.length != 1)
ints = 100;
else
ints = (int)Math.round(d[0]);
if (ints <= 0)
tracer.setIntervals(graph.getIntervals());
else
tracer.setIntervals(ints);
Variable v = tracer.getValueAsVariable();
crosshair = new Crosshair( new ValueMath(xFunc,v), new ValueMath(yFunc,v) );
crosshair.setLineWidth(3);
crosshair.setColor(getColorParam("CrosshairColor",Color.gray));
canvas.add(crosshair);
if (inputPanel != null) {
inputPanel.add(tracer,BorderLayout.WEST);
}
else if (limitsPanel == null) {
Panel p = new Panel();
p.add(tracer);
mainPanel.add(p,BorderLayout.SOUTH);
}
// if inputPanel is null but limitsPanel is not null, the tracer will be
// added to the limit control panel in setUpLimitsPanel()
}
canvas.add(graph); // Finally, add the graph to the canvas.
} // end setUpCanvas()
protected void setUpLimitsPanel() {
super.setUpLimitsPanel();
if (limitsPanel != null && tMin != null) { // add parameter inputs to limits panel
limitsPanel.addComponentPair(tMin,tMax);
limitsPanel.addComponent(tIntervals);
}
if (inputPanel == null && tracer != null && limitsPanel != null) {
limitsPanel.addComponent(tracer);
}
}
protected void setUpBottomPanel() { // override this to make a panel containing inputs for two functions
if ( ! "no".equalsIgnoreCase(getParameter("UseFunctionInput", "yes")) ) {
inputPanel = new JCMPanel();
inputPanel.setBackground( getColorParam("PanelBackground", Color.lightGray) );
Panel in = new JCMPanel(2,1);
inputPanel.add(in,BorderLayout.CENTER);
if ( ! "no".equalsIgnoreCase(getParameter("UseComputeButton", "yes")) ) {
String cname = getParameter("ComputeButtonName", "New Functions");
computeButton = new Button(cname);
inputPanel.add(computeButton, BorderLayout.EAST);
computeButton.addActionListener(this);
}
String varName = getParameter("Variable");
String def = getParameter("Function");
if (def == null)
def = "cos(" + varName + ") + cos(3*" + varName + ")";
functionInput = new ExpressionInput(def,parser);
String label = getParameter("FunctionLabel");
if ("none".equalsIgnoreCase(label))
in.add(functionInput);
else {
Panel p = new JCMPanel();
p.add(functionInput,BorderLayout.CENTER);
p.add( new Label(label), BorderLayout.WEST );
in.add(p);
}
def = getParameter("Function2");
if (def == null)
def = "sin(4*" + varName + ") - sin(2*" + varName + ")";
functionInput2 = new ExpressionInput(def,parser);
label = getParameter("FunctionLabel2");
if ("none".equalsIgnoreCase(label))
in.add(functionInput2);
else {
Panel p = new JCMPanel();
p.add(functionInput2,BorderLayout.CENTER);
p.add( new Label(label), BorderLayout.WEST );
in.add(p);
}
mainPanel.add(inputPanel, BorderLayout.SOUTH);
functionInput.setOnUserAction(mainController);
functionInput2.setOnUserAction(mainController);
}
}
protected void setUpMainPanel() { // Override to set up controller for tracer, if there is one
super.setUpMainPanel(); // Do the common setup
if ( tracer == null ) {
return; // If the applet is not configured to use a trace button, there is nothing to do.
}
Controller traceController = new Controller(); // A controler that will only recompute the crosshair position
traceController.add(tracer);
traceController.add(crosshair);
tracer.setOnChange(traceController);
} // end setUpMainPanel()
protected void doLoadExample(String example) {
// This method is called when the user loads an example from the
// example menu (if there is one). It overrides an empty method
// in GenericGraphApplet.
// For the Parametric applet, the example string should contain
// two expression that defines the curve to be graphed, separated
// by a semicolon. This can optionally
// be followed by another semicolon and a list of four to seven numbers.
// The first four numbers give the x- and y-limits to be used for the
// example. If they are not present, then -5,5,-5,5 is used. The
// next three numbers specify the minimum value for the parameter, the
// maximum value, and the number of intervals into which the range of
// parameter values is divided.
if (tracer != null)
tracer.stop();
int pos = example.indexOf(";");
if (pos == -1)
return; // illegal example -- must have two functions
String example2 = example.substring(pos+1);
example = example.substring(0,pos);
pos = example2.indexOf(";");
double[] limits = { -5,5,-5,5 }; // x- and y-limits to use
if (pos > 0) {
// Get limits from example2 text.
String nums = example2.substring(pos+1);
example2 = example2.substring(0,pos);
StringTokenizer toks = new StringTokenizer(nums, " ,");
if (toks.countTokens() >= 4) {
for (int i = 0; i < 4; i++) {
try {
Double d = new Double(toks.nextToken());
limits[i] = d.doubleValue();
}
catch (NumberFormatException e) {
}
}
}
if (toks.hasMoreTokens()) {
try {
double d = (new Double(toks.nextToken())).doubleValue();
if (tMin == null) {
graph.setTMin(new Constant(d));
if (tracer != null)
tracer.setMin(d);
}
else
tMin.setVal(d);
}
catch (NumberFormatException e) {
}
}
if (toks.hasMoreTokens()) {
try {
double d = (new Double(toks.nextToken())).doubleValue();
if (tMax == null) {
graph.setTMax(new Constant(d));
if (tracer != null)
tracer.setMax(d);
}
else
tMax.setVal(d);
}
catch (NumberFormatException e) {
}
}
if (toks.hasMoreTokens()) {
try {
int d = (int)Math.round((new Double(toks.nextToken())).doubleValue());
if (tIntervals == null) {
if (tracer != null && tracer.getIntervals() == graph.getIntervals())
tracer.setIntervals(d);
graph.setIntervals(new Constant(d));
}
else
tIntervals.setVal(d);
}
catch (NumberFormatException e) {
}
}
}
// Set up the example data and recompute everything.
if (functionInput != null) {
// If there is a function input box, put the example text in it.
functionInput.setText(example);
functionInput2.setText(example2);
}
else {
// If there is no user input, set the function in the graph directly.
try {
Function f = new SimpleFunction( parser.parse(example), xVar );
((WrapperFunction)xFunc).setFunction(f);
Function g = new SimpleFunction( parser.parse(example2), xVar );
((WrapperFunction)yFunc).setFunction(g);
}
catch (ParseError e) {
// There should't be parse error's in the Web-page
// author's examples! If there are, the function
// just won't change.
}
}
CoordinateRect coords = canvas.getCoordinateRect(0);
coords.setLimits(limits);
coords.setRestoreBuffer();
mainController.compute();
} // end doLoadExample()
public void stop() { // stop animator when applet is stopped
if (tracer != null)
tracer.stop();
super.stop();
}
public static void main(String[] a){
javax.swing.JFrame f = new javax.swing.JFrame();
Applet app = new Parametric();
app.init();
f.getContentPane().add (app);
f.pack();
f.setSize (new Dimension (500, 500));
f.setVisible(true);
}
} // end class Parametric
 jcm1-source.zip( 532 k)
Related examples in the same category